About AMR and Stata
The IBM Stata software will help us to analyze the antimicrobial resistance data. We can use cross tabulation, pearson's chi-squared test, bar, pie, line, box, histogram, and regression analysis to determine frequency distributions.
Outine
- Stata installtion
- Import CSV data
- Data cleaning
- Frequency check
- Number of isolates count by year
- Cross tabulation
- Pearson's Chi-squared test
- Plotting results
- Yearly antibiotics by organism
1. Stata installation
Visit the following website and follow the installation steps: https://julhas.com/jsedutech/materials/Level-1/Stata-Session-1.pdf
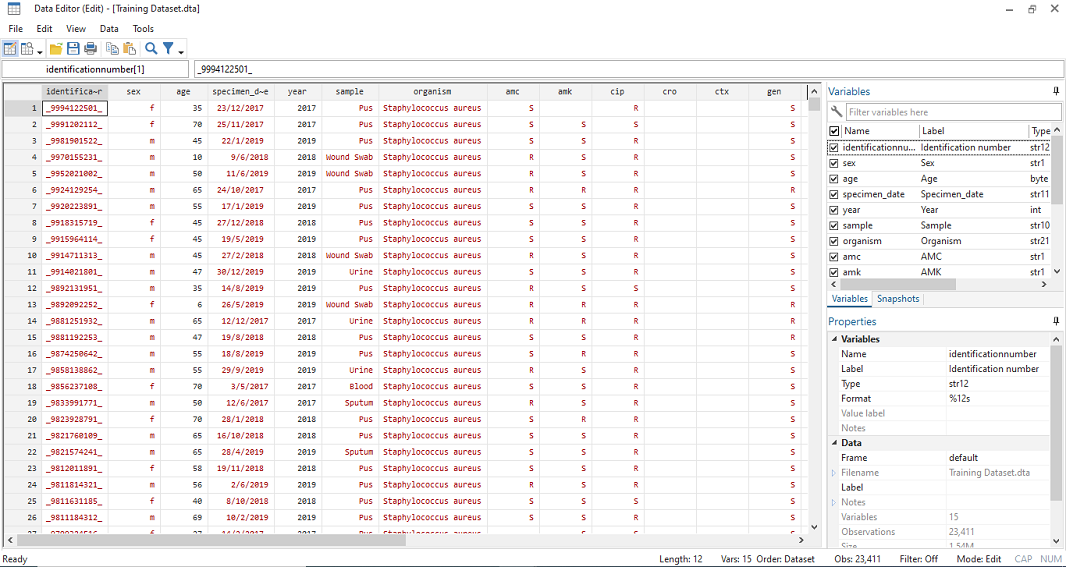
2. Import CSV/ Excel data
Visit the following website and follow the steps: https://julhas.com/jsedutech/materials/Level-1/Stata-Session-3.pdf
Output:
3. Data management
Visit the following website and follow the steps: https://julhas.com/jsedutech/materials/Level-1/Stata-Session-6.pdf
4. Frequency check
Frequency check - Gender, Year, Sample, Organism, Age group: A frequency distribution is a list, table or graph that displays the frequency of various outcomes in a sample.
Commands:

tab sex
tab year
tab sample
tab organism

Output:
. count
  23,411

. tab sex
        Sex |      Freq.     Percent        Cum.
------------+-----------------------------------
          f |     13,568       57.96       57.96
          m |      9,843       42.04      100.00
------------+-----------------------------------
      Total |     23,411      100.00

tab year
       Year |      Freq.     Percent        Cum.
------------+-----------------------------------
       2017 |      6,878       29.38       29.38
       2018 |      8,072       34.48       63.86
       2019 |      8,461       36.14      100.00
------------+-----------------------------------
      Total |     23,411      100.00

. tab sample
     Sample |      Freq.     Percent        Cum.
------------+-----------------------------------
      Blood |      1,214        5.19        5.19
        Pus |      5,753       24.57       29.76
     Sputum |      1,079        4.61       34.37
      Stool |          2        0.01       34.38
      Urine |     12,814       54.73       89.11
 Wound Swab |      2,549       10.89      100.00
------------+-----------------------------------
      Total |     23,411      100.00

. tab organism

             Organism |      Freq.     Percent        Cum.
----------------------+-----------------------------------
     Escherichia coli |     11,887       50.78       50.78
       Klebsiella sp. |      7,709       32.93       83.70
Staphylococcus aureus |      3,815       16.30      100.00
----------------------+-----------------------------------
                Total |     23,411      100.00
5. Number of isolates count by year
Commands:

count if year == 2019
tab amk if year == 2017

Output:

. count if year == 2019
8,461

. tab amk if year == 2017

        AMK |      Freq.     Percent        Cum.
------------+-----------------------------------
          I |          2        0.03        0.03
          R |        999       14.91       14.94
          S |      5,697       85.06      100.00
------------+-----------------------------------
      Total |      6,698      100.00
6. Cross tabulation
Cross tabulation: It is used to quantitatively analyze the relationship between multiple variables.
Commands:
tab sex year
tab organism year, col nofreq // Display only percentage
tab sample year, col // Number and percentage

Output:

. tab sex year

           |               Year
       Sex |      2017       2018       2019 |     Total
-----------+---------------------------------+----------
         f |     4,038      4,602      4,928 |    13,568
         m |     2,840      3,470      3,533 |     9,843
-----------+---------------------------------+----------
     Total |     6,878      8,072      8,461 |    23,411

. tab organism year, col nofreq // Display only percentage

                      |               Year
             Organism |      2017       2018       2019 |     Total
----------------------+---------------------------------+----------
     Escherichia coli |     54.04      49.55      49.28 |     50.78
       Klebsiella sp. |     28.58      34.64      34.83 |     32.93
Staphylococcus aureus |     17.37      15.81      15.88 |     16.30
----------------------+---------------------------------+----------
                Total |    100.00     100.00     100.00 |    100.00

. tab sample year, col // Number and percentage

+-------------------+
| Key               |
|-------------------|
|     frequency     |
| column percentage |
+-------------------+

           |               Year
    Sample |      2017       2018       2019 |     Total
-----------+---------------------------------+----------
     Blood |       361        399        454 |     1,214
           |      5.25       4.94       5.37 |      5.19
-----------+---------------------------------+----------
       Pus |     1,578      1,979      2,196 |     5,753
           |     22.94      24.52      25.95 |     24.57
-----------+---------------------------------+----------
    Sputum |       336        376        367 |     1,079
           |      4.89       4.66       4.34 |      4.61
-----------+---------------------------------+----------
     Stool |         0          0          2 |         2
           |      0.00       0.00       0.02 |      0.01
-----------+---------------------------------+----------
     Urine |     3,993      4,256      4,565 |    12,814
           |     58.05      52.73      53.95 |     54.73
-----------+---------------------------------+----------
Wound Swab |       610      1,062        877 |     2,549
           |      8.87      13.16      10.37 |     10.89
-----------+---------------------------------+----------
     Total |     6,878      8,072      8,461 |    23,411
           |    100.00     100.00     100.00 |    100.00
7. Pearson's Chi-squared test
Pearson's Chi-squared test: Pearson's chi-squared test (χ2) is a statistical test applied to sets of categorical data to evaluate how likely it is that any observed difference between the sets arose by chance.
Commands:
tabulate ageGroup1 sample, chi2
tabulate organism sample, chi2

Output:

. tabulate ageGroup1 sample, chi2

            |                              Sample
  ageGroup1 |     Blood        Pus     Sputum      Stool      Urine  Wound S.. |     Total
------------+------------------------------------------------------------------+----------
  <=4 Years |        47         66          0          1        241        202 |       557
 5-14 Years |        21         54          2          0        103        347 |       527
15-24 Years |        27        120         23          1        257        329 |       757
25-34 Years |        34        299         41          0        731        328 |     1,433
35-44 Years |       117        818         91          0      1,388        275 |     2,689
45-54 Years |       247      1,580        215          0      2,792        404 |     5,238
55-64 Years |       337      1,636        299          0      3,503        392 |     6,167
>= 65 Years |       384      1,180        408          0      3,799        272 |     6,043
------------+------------------------------------------------------------------+----------
      Total |     1,214      5,753      1,079          2     12,814      2,549 |    23,411

         Pearson chi2(35) =  3.9e+03   Pr = 0.000

. tabulate organism sample, chi2

                      |                              Sample
             Organism |     Blood        Pus     Sputum      Stool      Urine  Wound S.. |     Total
----------------------+------------------------------------------------------------------+----------
     Escherichia coli |       640      1,041        105          2      9,800        299 |    11,887
       Klebsiella sp. |       351      2,299        848          0      2,508      1,703 |     7,709
Staphylococcus aureus |       223      2,413        126          0        506        547 |     3,815
----------------------+------------------------------------------------------------------+----------
                Total |     1,214      5,753      1,079          2     12,814      2,549 |    23,411

         Pearson chi2(10) =  9.9e+03   Pr = 0.000
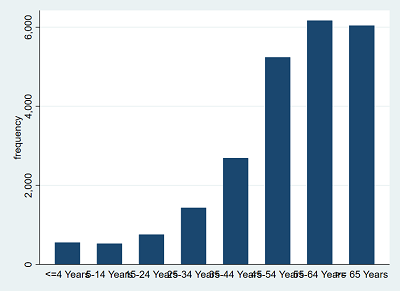
8. Plotting results
// Histogram
histogram age

// Box plot
graph box age

// Bar graph
graph bar (count), over(ageGroup1) stack

// Bar graph with more than one categorical variables
graph bar (count), over(ageGroup1) over(sex) stack

// Pie chart
graph pie, over(sex)
graph pie, over(sex) title(Gender distribution)
graph pie, over(sex) title(Gender distribution) legend(on) scheme(s2color)

Output: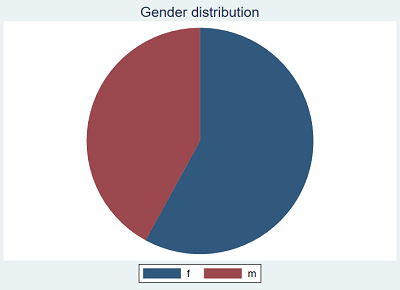
9. Yearly antibiotics by organism
Commands:
tab amc year if organism == "Escherichia coli", col nofreq
tab amc year if organism == "Klebsiella sp.", col nofreq
tab amc year if organism == "Staphylococcus aureus", col

Output:
. tab amc year if organism == "Escherichia coli", col nofreq

           |               Year
       AMC |      2017       2018       2019 |     Total
-----------+---------------------------------+----------
         R |     75.14      70.07      73.57 |     72.84
         S |     24.86      29.93      26.43 |     27.16
-----------+---------------------------------+----------
     Total |    100.00     100.00     100.00 |    100.00


. tab amc year if organism == "Klebsiella sp.", col nofreq

           |               Year
       AMC |      2017       2018       2019 |     Total
-----------+---------------------------------+----------
         R |     68.89      71.05      70.59 |     70.33
         S |     31.11      28.95      29.41 |     29.67
-----------+---------------------------------+----------
     Total |    100.00     100.00     100.00 |    100.00


. tab amc year if organism == "Staphylococcus aureus", col

+-------------------+
| Key               |
|-------------------|
|     frequency     |
| column percentage |
+-------------------+

           |               Year
       AMC |      2017       2018       2019 |     Total
-----------+---------------------------------+----------
         R |       412        446        530 |     1,388
           |     38.98      36.44      40.30 |     38.60
-----------+---------------------------------+----------
         S |       645        778        785 |     2,208
           |     61.02      63.56      59.70 |     61.40
-----------+---------------------------------+----------
     Total |     1,057      1,224      1,315 |     3,596
           |    100.00     100.00     100.00 |    100.00